This is a new series I plan to do, I am not sure how long I will be able to stick with it/ how frequently I can update. If you enjoy these posts let me know and I will do more paper reviews, if you don’t I will still probably do more but I wont post them. Also, if you have feedback on the format of the review let me know, I am not trying to be mean in my reviews, in fact I am only selecting papers thus far that I find interesting, but I am intentionally including critiques because I think that is an important aspect of peer reviewed papers.
Paper Title: Marker-free stitching deflectometry for three-dimensional measurement of the specular surface
Authors: Ruiyang Wang, Dahai Li, Xinwei Zhang, Wanxing Zheng, Linzhi Yu, and Renhao Ge
Source: Marker-free stitching deflectometry for three-dimensional measurement of the specular surface
Summary: The authors have created an algorithmic innovation that allows them to utilize 2 screens in a deflectometry test setup to measure two overlapping areas of a larger surface under test. Their algorithm then stitches the two datasets together in one seamless, large, tested area, all with no markers on the optic! It turns out that it works fairly well.
Full Review:
This was a fun paper to read, mostly as it applies directly to my graduate work, but more broadly because finding clever ways to maximize optics related things by making better algorithms (ie, the whole promise of computers), just seems like a greatly undervalued area of research.
Onto the review, some very clever authors created a deflectometry process that allows them to test large specular surfaces by creating a seamless, stitched data set from smaller overlapping measurement areas, all without markers on the test surface.
How the small community of people who do deflectometry all look.
What is deflectometry?:
One liner: Deflectometry is an optical non-contact non-null metrology method that measures the local surface slopes of a surface under test.
Layman’s Terms: If you see how something you know reflects off a ‘mirror’ you are measuring, you can figure out the shape of the mirror. See here for a (hopefully fun) video I made explaining it:
And for a more technical explanation see section 2 of this paper: http://www.loft.optics.arizona.edu/documents/journal_articles/oe-27-20-28660.pdf
The authors state succinctly “Deflectometry is a slope metrology based on the law of reflection, and the slope is further integrated to reconstruct the surface. The slope is measured by sensing the deflection of ray that is reflected off the surface of the unit under test (UUT). “ What this means is practical terms is we take a computer screen often, put fringes on it for a phase shifting test, and the fringed reflect off our optic under test, and a camera captures the reflected light. Using algorithms, we correlate where the light originated from on the computer screen, and what part of the surface it reflected from, and by knowing where our camera is we have three points and can use geometry to calculate the required slope of the surface to achieve that reflection. If we do this all over our surface we are testing we get the full local surface slope map, which can be integrated to get the reconstructed surface.
This all practically means that deflectometry is often used to measure a test surface because it tends to be cheap, ‘easy’, and quick to get a surface measurement of an optical surface. It also tends to not be as accurate as interferometry, unless you absolutely calibrate your system to the nth degree, in which case angstrom level surface accuracy is achievable [1].
Why should we care as readers?

It turns out that while deflectometry is great (according to some of us), it also can struggle with testing large surfaces. If you are familiar with interferometry, you should understand this well; larger optical apertures require a large source to test them. For deflectometry, there is a limit to how large of a screen we deploy, and even though tv’s are getting larger and cheaper, there are some serious downsides to accuracy with a larger source, including sag, uniformity issues, etc. The author’s explain the problem quite well:
“It is difficult to measure large size optics. To ensure the light emitted from the screen are reflected off the UUT and captured by the camera, either a very large screen is used or only a very small part of the UUT is measured. For conventional passive deflectometry, the measured area is usually even smaller than a mono-deflectometry configuration. A common way to enlarge the testing aperture is sub-aperture stitching, mainly applied in interferometer [15,16] and Hartmann-Shack test [17]. “
Let’s say we are stuck with a big 1 meter class optical surface. We also have some optical system that really needs a 1 meter optic, and we even know what surface shape we need it to be, an astigmatic surface with no power. The only thing we don’t know is if the surface of our 1 meter optic matches our needs.
What are our options? We could write up grants and try to obtain a 1 meter aperture interferometer, but that sounds like a headache. We could hope we already have a suitable interferometer, but what if we have no matching null? Then we have to spend a bunch of money and time on a custom null. Or, we can create a deflectometry test setup. We know we have a good tv in our lab, and a few cameras lying around, so the obvious choice is to set up this new fangled stereo-deflectometry system we’ve read so much about.
Unfortunately, once we turn everything on, we find that camera 1 only measures the left side of our optic, while camera 2 only measures the right side.

Who needs large optics anyways?
After we process the data it looks like the surface on each half meets our requirements, but how do we know if we can trust each camera? Even worse, how do we know each camera is in fact measuring the right area on the test surface? We could use photoshop or be really clever and program a stitching algorithm, but again we don’t really know that when we stitch our data together it is mapping the correct surface height values to their correct locations on the optical surface. Alternatively, we could put markers (also known as fiducials) on our test surface before we measure it, but this would require touching the surface which we don’t want to do, and the markers will block our ability to measure the surface where they are placed, and maybe we really care about knowing the entire optical surface with no missing areas. What are we to ask in despair? Write our own paper? No, somebody has already solved your problem! Thanks to Wang, et. al., we can use stereo deflectometry to measure sub-aperture areas on our big optic, and using their algorithms, we can now seamlessly stitch these sub-apertures together, no markers required, into one big accurate surface map.
What did the author’s do?:
Wang, et. al, created a
“marker-free stitching deflectometry that utilizes the stereo-iterative algorithm to calculate the sub-aperture point cloud without height-slope ambiguity, and the overlapping area is identified with the point cloud datum. The point cloud within the sub-aperture is measured based on a stereo-iterative reconstruction algorithm. And the sub-apertures from different camera views are stitched together with the proposed stitching method”
And their key contributions, as identified by the authors are:
“
- a) Apart from monoscopic sub-aperture calculation, the stereo-iterative algorithm is proposed. This allows the point cloud calculation of sub-apertures without height-slope ambiguity.
- b) The use of marker on the UUT is eliminated, as the point cloud already carries overlapping area data.
- c) The stitching algorithm is proposed to eliminate stitching errors between sub-apertures and provide a final full-aperture height map.
- d) The measured area is significantly enlarged compared to conventional passive deflectometry.
“
Already this is shaping up to be a great paper from a reader’s standpoint. Including a high level ‘here are the key things we did that you should care about’ saves the reader so much time. So, credit to Wang, et. al. for doing this.
I have a slight issue with the contributions, as a and c are somewhat tied together as one function, and b and d are natural by-products, but enough nit-picking, onto how they did it.
How they did it:
The authors state that each camera is calibrated, by calculating the internal distortion matrices. Also, the translation and rotation of all components are recorded*. Next, each camera captures a measurement set from the deflectometry setup of the optic under test, with each camera measuring overlapping but distinct areas.
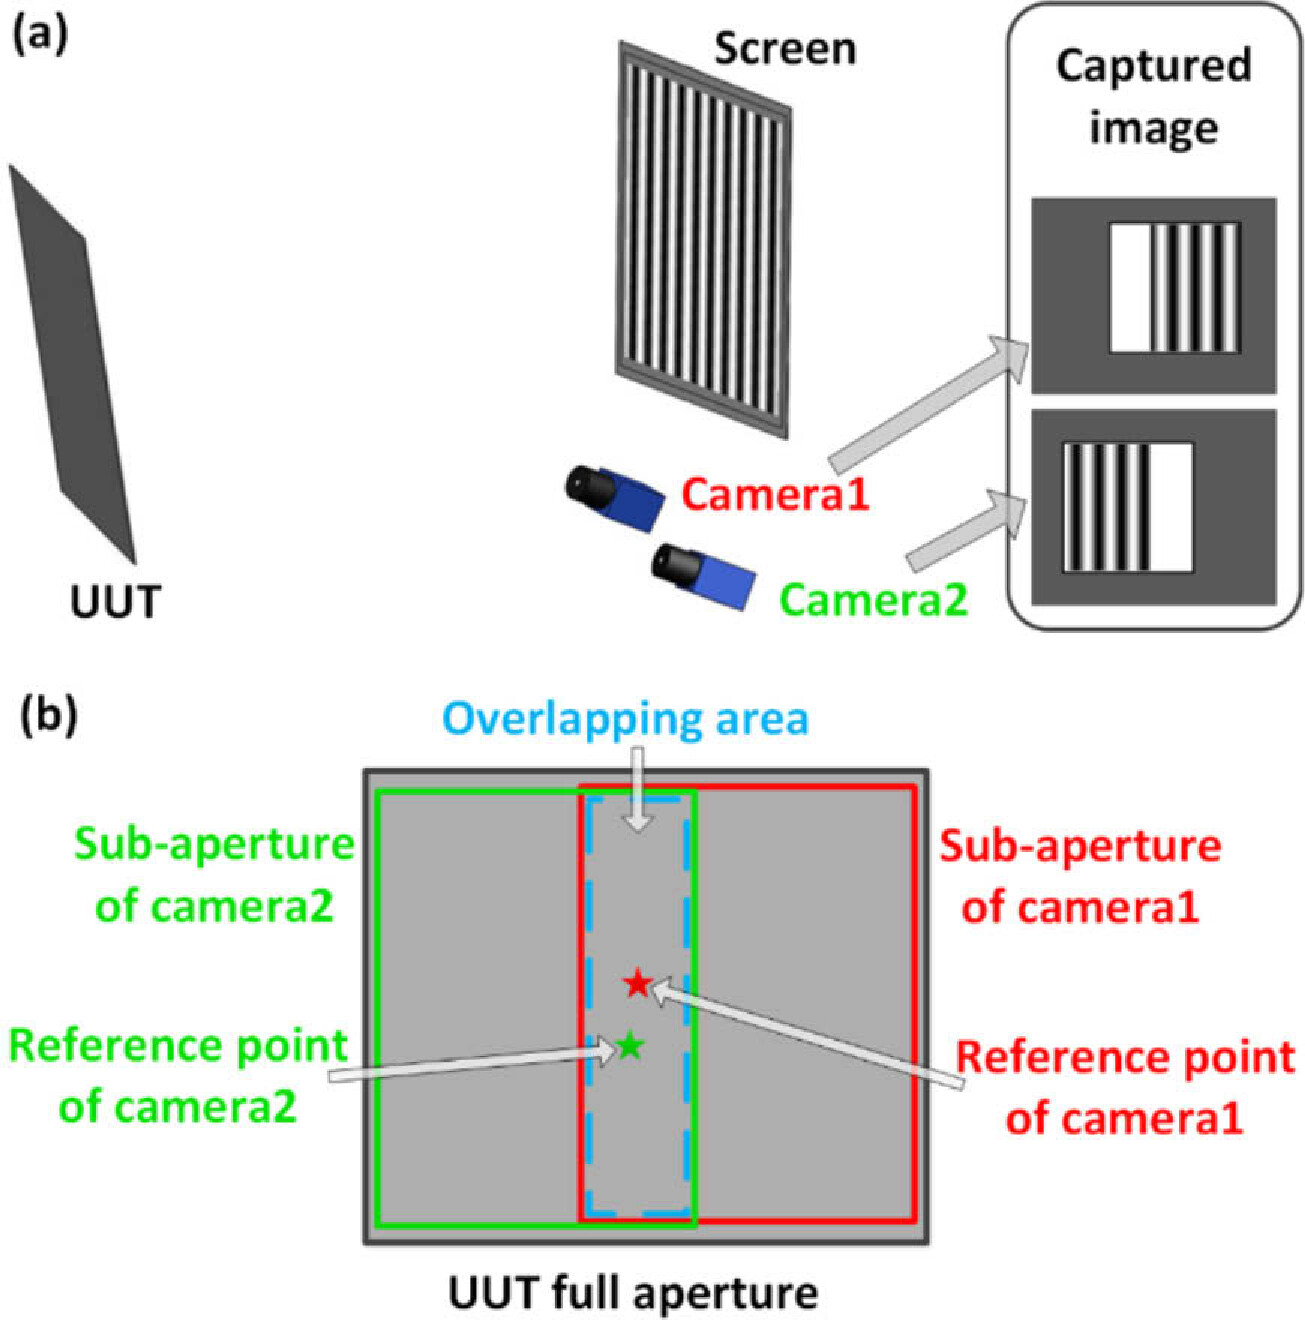
Figure 1 in the paper, showing how each camera measures a unique but overlapping area of the unit under test (UUT). Credit: Wang, et. al.,.
Next, they convert the raw data into a reconstructed surface measurement for each camera. They use a stereo-searching algorithm to determine the reference point for each camera, and then iteratively reconstruct the sub-aperture surfaces.
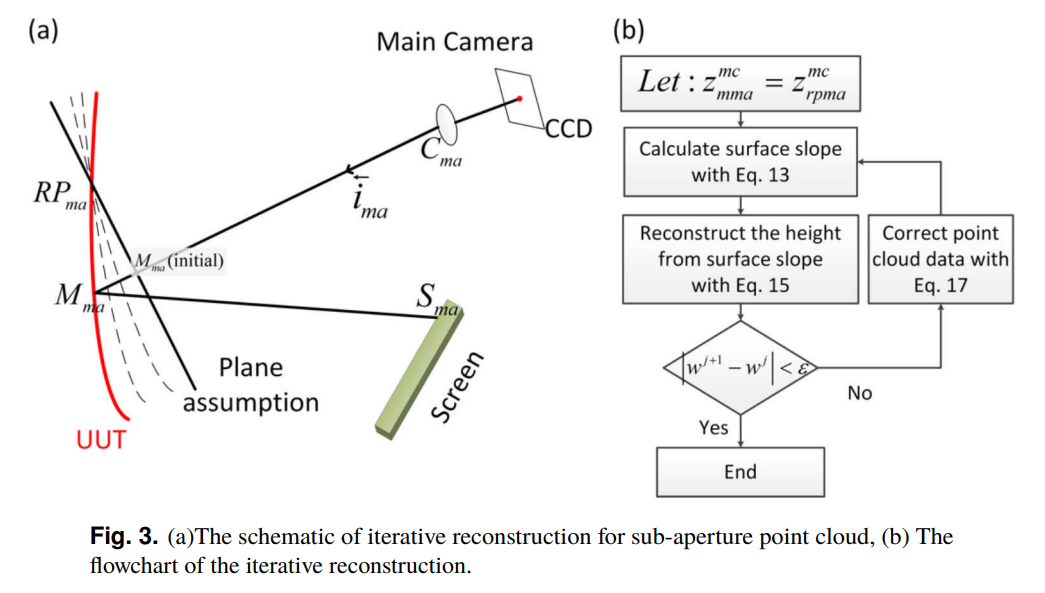
Figure 3 in the paper, highlighting how the surface is iteratively reconstructed. It is usually a massive pain trying to show this information, very impressed by the quality of the drawing and that they managed to get their flow chart in there as well.
They start with a flat surface assumption, calculate a surface which is fit using polynomials (they use Zernike polynomials), and the new surface model is then used to correct the surface model. They additionally fix one point on their surface model, so the iterative method doesn’t simply enter into a null solution space and give them silly results (or at least it is hoped that is what is achieved). They iterate until the change between surfaces converges to some point below a predetermined error value. They have a robust, if frustrating to follow, mathematical derivation of this work in section 2.1, which I encourage anyone interested to go through.
Basically, each time they loop through that surface better be a more accurate model than last time

Finally, once each sub-aperture has converged, the two sub-apertures are stitched together. If the surface reconstruction was ‘perfect’ then we should expect that only a rigid body transformation of each sub-aperture would be required to perfectly fit the two segments together. Ie, something like this:
However, due to built in systematic errors, from some camera distortion that isn’t fully calibrated out to positional uncertainties the final reconstructed surfaces will inherently have some error built in, hence why stitching is really hard. The authors solve this by, uh, well actually its not really clear. They state that after they get each sub-aperture point cloud, they simply take the area of overlap, resample the data to 3D surface coordinates from dataset 1 of [x,y, 𝑧𝑟𝑒𝑠𝑢𝑏1], and surface coordinates from dataset 2 of [x,y, 𝑧𝑟𝑒𝑠𝑢𝑏2]. If you are not familiar with sampling issues, suffice to say how you sample is really important, if you are familiar, red flags should be going off. The authors don’t explain how the resampling is done, what points are chosen, or how 𝑧𝑟𝑒𝑠𝑢𝑏1 and 𝑧𝑟𝑒𝑠𝑢𝑏2 are determined. If the x and y points are new sampling points, then the reader can assume some interpolation was required, but the specifics of the interpolation are not shared, which again is a pretty serious flaw. However, moving on, once the resampling has occurred, the authors state that “The difference between 𝑧𝑟𝑒𝑠𝑢𝑏1 and 𝑧𝑟𝑒𝑠𝑢𝑏2 is regarded as a stitching error to be removed:”. That is a large assumption, but they clearly state it so it is not necessarily a problem. However, for practical purposes, if you are to implement this method for your own tests, there are a lot of reasons to assume the difference is z heights is not just a stitching error. How confident are you in the camera calibration? The position of the components of your deflectometry setup (these have a massive impact on the accuracy of your surface reconstruction, microns of position uncertainty, which is standard even when calibrating position with a high quality CMM machine, can result in several microns of error in a reconstructed surface [2])? What about your confidence in your actual data processing algorithm and surface reconstruction? To me, the assumption that the height error is just a stitching artifact seems implausible, so I hope the authors will do a follow up study to determine how much of that mismatch is just from stitching issues and how much is systematic error that resulted in an incorrect reconstructed surface.
Frankly, I hope someone else does a follow up analysis, and for the time being im just going to assume things work great. My mental image of the sub-apertures as they combine into one glorious full aperture is something like this:
Wow! what a great stitching process.
How well does it work?:
The authors run a simulation to model a deflectometry measurement with their proposed approach. The data is then processed following the methods proposed and the reconstructed surface is compared to the ideal simulated surface. Simulations like this are great, because you can control for all of those messy sources of error that plague deflectometry setups in the real world: distortion, position uncertainties, environmental noise, etc. So, ideally, the reconstructed surface, with all sources of real world error controlled, should match the ideal surface. Already, something funny is happening in the paper. The reconstructed surface is ~75 nm off from the ideal surface, with no terms removed. In a real world test that would be incredible, but for a simulation it is a little disturbing, as we see that the primary error is tilt, which is odd to me. However, after removing some surface Zernike terms, which the authors state are “The piston and tilt terms are removed from the height to demonstrate the reconstructed shape of the UUT. The shape and shape error are shown in Fig. 5(c) and 5(d), respectively. “ I believe the “shape and shape errors” to be tilt and astigmatism, just from looking at figure 5. Removing tilt, and what appears to be astigmatism, results in a reconstructed surface error of ~129 nm and ~0.12 nm respectively. Ok, angstrom level accuracy, this is now looking more promising. I still have residual concern about the level of tilt and astigmatism error in the reconstruction, as that shouldn’t be there for a simulation where there is no distortion or system errors, and I am inclined to think this arises from the iterative reconstruction, but it also could be arising from the stitching. Unfortunately, it isn’t clear why it is present, and a follow on paper would be needed to hammer out the source of this error.
Simulations are all well and good (seriously, they are great, if you are writing a paper take the few days time to include one), but how well does it really work? Well, the authors created a test using their method to measure a 1/10th ƛ flat mirror.
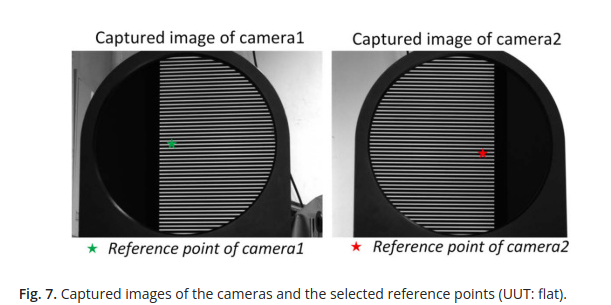
Fringes look pretty flat to me, seems like a great calibration flat. Also, clearly illustrates why stitching is needed.

They reconstruct the measured flat surface, and compare their results to an interferometer. Again, this is a great test, using a ‘gold-standard’ reference is very helpful to see how much absolute difference we may expect from using said gold standard verses the proposed method. They determine, after removing piston and tilt, that their method has about 100 nm RMS difference from the interferometer measurement.
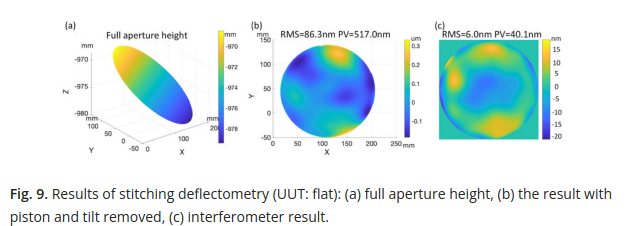
Figures b and c don’t look too similar to me, and I’m surprised the nasty astigmatism that showed up in the simulations isn’t a problem in this real world test. However, we tend to use deflectometry for measuring higher spatial frequency surface features anyways. Once again, the authors expertly provide an excellent comparison resource for the reader and show the fit Zernike coefficients for the deflectometry reconstructed surface and the interferometer measurement.
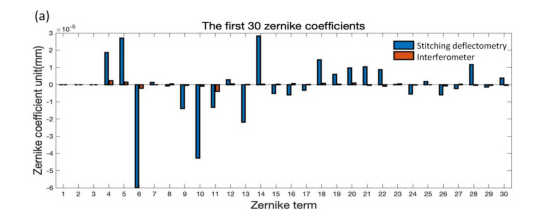

There is a big mismatch between the interferometer fitting and the deflectometry fitting. However, this may not be a problem! Or, I should say it is a problem but it is not clear just yet where the problem comes from primarily. Is this a problem with the deflectometry system itself, or with the proposed stitching algorithm? The authors defend that it is mostly systematic error and not stitching error in the text around figure 10. I don’t find their argument too compelling, fortunately, they provide a comparison of an optic reconstructed from a test from a standard, full aperture deflectometry system, and their stitching deflectometry system.
This is where the loop closes, and I personally am convinced that any error in the reconstructed surface is more systematic error and calibration issues in the hardware than a problem with their proposed stitching algorithm. You can see the reconstructed surfaces below.
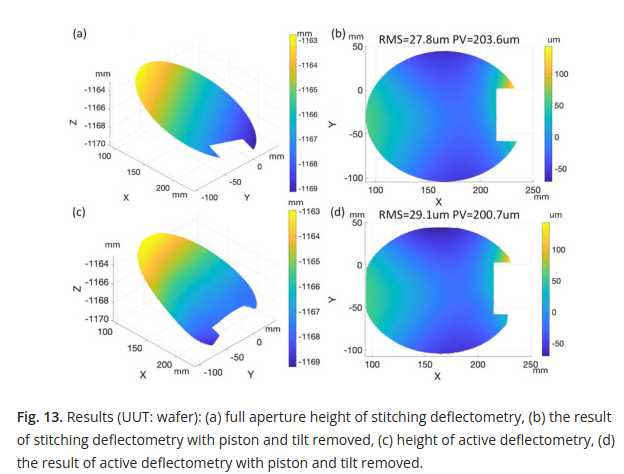
And more importantly, because it looks like the surface maps don’t actually match (the stitching deflectometry looks like it clipped the surface in 13d to me?), they fit zernike terms to the reconstructed maps, shown below.
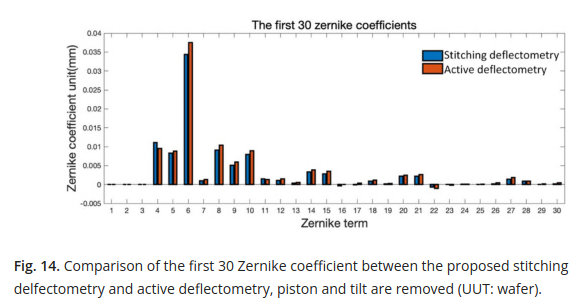
Ah! Now we see that both deflectometry systems, one ‘traditional’ and one using the proposed stitching method, arrive at nearly identical reconstructed surfaces, and that when zernike terms are fit, they match closely. This helps to convince me that the difference between the stitching deflectometry and interferometry results shown earlier are simply systematic and calibration errors, which so commonly plague deflectometry.
What I liked about this paper:
The authors provided good figures. Seriously, so many figures in optics papers are just utter garbage, it is refreshing to see well made figures. They still don’t live up to the standard set by medical/ biology papers, but thats ok.
The authors provided a ton of test evidence to demonstrate efficacy, and each test naturally answered questions that had arisen. Simulations are great at showing ideal performance. Real test results compared to a gold standard are great to show how ‘accurate’ we may expect the proposed work to be. In this case, it frankly is not terribly impressive, having around a 100 nm RMS difference from interferometry, but that is fine because we as readers just want to know how accurate the new method is. Finally, by comparing the new method to the more traditional version of deflectometry, which should capture the same or similar systematic errors and calibration concerns, they demonstrate that their method in fact matches well with the traditional method, but provides the added benefit of marker free stitching, thus allowing for easier full aperture surface reconstructions of surfaces that traditional deflectometry would otherwise not be able to measure.
Robust mathematical derivations. Optics papers often don’t include raw code, so if you want to recreate algorithms to use the proposed method, you have to follow the math provided. Clear equations are at a premium unfortunately in optics paper in general, so having detailed equations that the reader can follow is a must.
Conclusion
Overall I am fairly excited about this paper, as it looks compelling to me that the authors created a method that allows for easy stitching, with no markers required, of sub-aperture measurements of a surface by a deflectometry system. This is a needed improvement for deflectometry. There are some areas I am not so excited about. There is a big assumption about stitching error not being caused by reconstruction errors in each sub-aperture, and the way those errors are handled seems a little suspect to me, so if you implement for yourself let me know as I would love to see it in practice. Also, I am inclined to believe that the large deviation in reconstruction results between the proposed method and an interferometer test are mostly due to calibration errors, but a follow on study would be needed to demonstrate that definitely. This was a fun paper for me with the connection to deflectometry, and I hope it results in more deflectometry systems in use, as they are really easy and cheap to create. Some crazy person I know even made one from an iphone [3]!

how you’ll feel after you built your own iphone deflectometer.
[1]Run Huang, Peng Su, James H. Burge, Mourad Idir, “X-ray mirror metrology using SCOTS/deflectometry,” Proc. SPIE 8848, Advances in X-Ray/EUV Optics and Components VIII, 88480G (27 September 2013); https://doi.org/10.1117/12.2024500
[2]L. R. Graves, H. Choi, W. Zhao, C. J. Oh, P. Su, T. Su, D. W. Kim, “Model-free optical surface reconstruction from deflectometry data,” Proc. SPIE 10742, Optical Manufacturing and Testing XII, 107420Y (14 September 2018); https://doi-org.ezproxy2.library.arizona.edu/10.1117/12.2320745
[3]Isaac Trumper, Heejoo Choi, and Dae Wook Kim, “Instantaneous phase shifting deflectometry,” Opt. Express 24, 27993-28007 (2016)